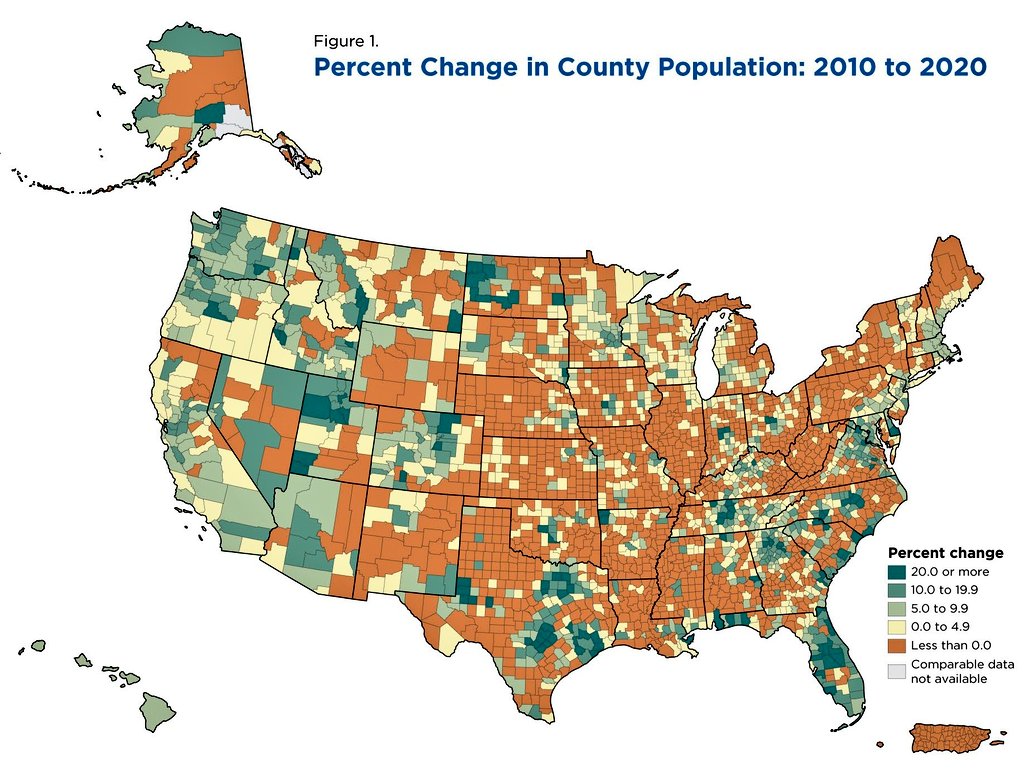
US County Population Change 2010 to 2020 Map
A Census-style county map showing US population change from 2010 to 2020, with much of the Midwest and Plains shrinking while the South and West grew.
Image description
Choropleth map of the United States titled "Figure 1. Percent Change in County Population: 2010 to 2020." Counties are shaded by population change. Legend "Percent change": 20.0 or more, 10.0 to 19.9, 5.0 to 9.9, 0.0 to 4.9, Less than 0.0, Comparable data not available.

Comments
No comments yet. Start the thread.
Log in to comment and save favorites.