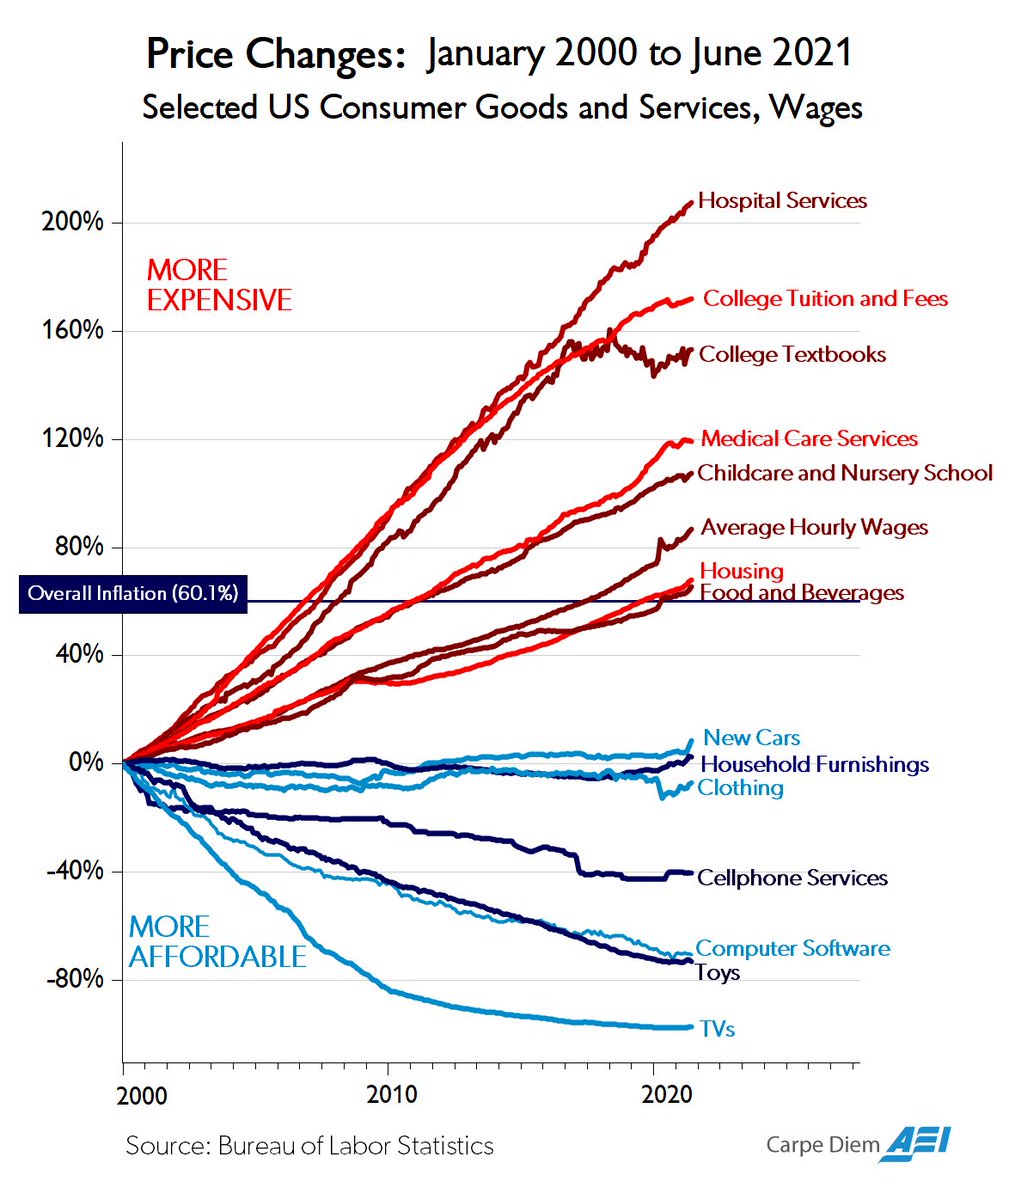
Prices Since 2000: Hospitals Soar, TVs Sink
A Bureau of Labor Statistics chart shows hospital, college and childcare costs soaring since 2000 while TVs, toys and software got cheaper, a sore spot for grown-up Xennials.
Image description
Line chart titled "Price Changes: January 2000 to June 2021. Selected US Consumer Goods and Services, Wages." A horizontal line marks "Overall Inflation (60.1%)". Red labels at top mean "MORE EXPENSIVE"; blue at bottom "MORE AFFORDABLE". Lines from highest to lowest: Hospital Services (about 207%), College Tuition and Fees, College Textbooks, Medical Care Services, Childcare and Nursery School, Average Hourly…


Comments
No comments yet. Start the thread.
Log in to comment and save favorites.