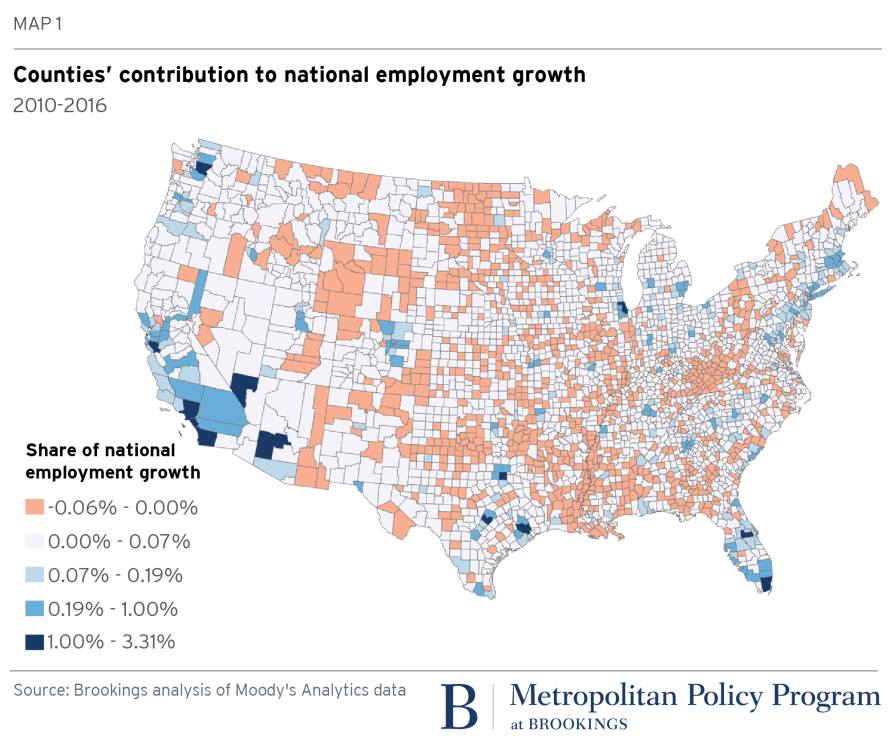
Counties' Share of National Job Growth Map, 2010-2016
A Brookings county map of US job growth from 2010 to 2016 shows a few big metro counties driving most gains, a data-class lesson in the wealth gap Xennials know.
Image description
Brookings map titled "MAP 1: Counties' contribution to national employment growth, 2010-2016" showing US counties shaded by share of national employment growth. Legend: -0.06% - 0.00%, 0.00% - 0.07%, 0.07% - 0.19%, 0.19% - 1.00%, 1.00% - 3.31%. Source: Brookings analysis of Moody's Analytics data. Metropolitan Policy Program at Brookings.






Comments
No comments yet. Start the thread.
Log in to comment and save favorites.