Skip to the memes
Xennial Memes
Topics
Your favorites
Topics
/
Everything else
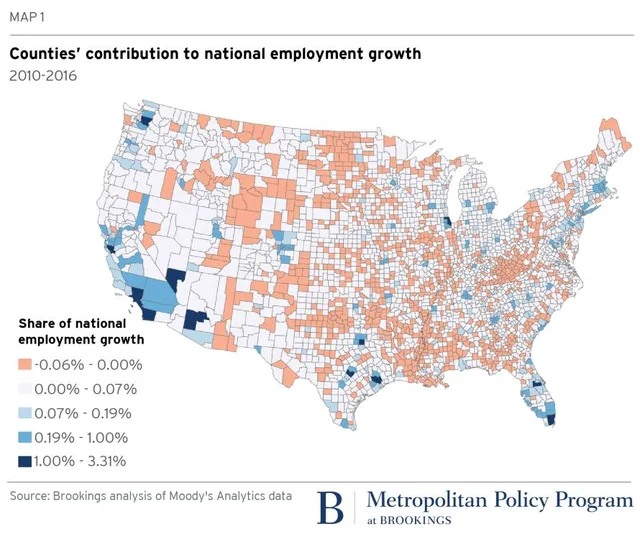
Employment Growth Map
Often tagged with
Election 2016
News Media
Social Studies
Wealth Gap
Counties' Share of National Job Growth Map, 2010-2016