Xennial Memes

Topics Adulting

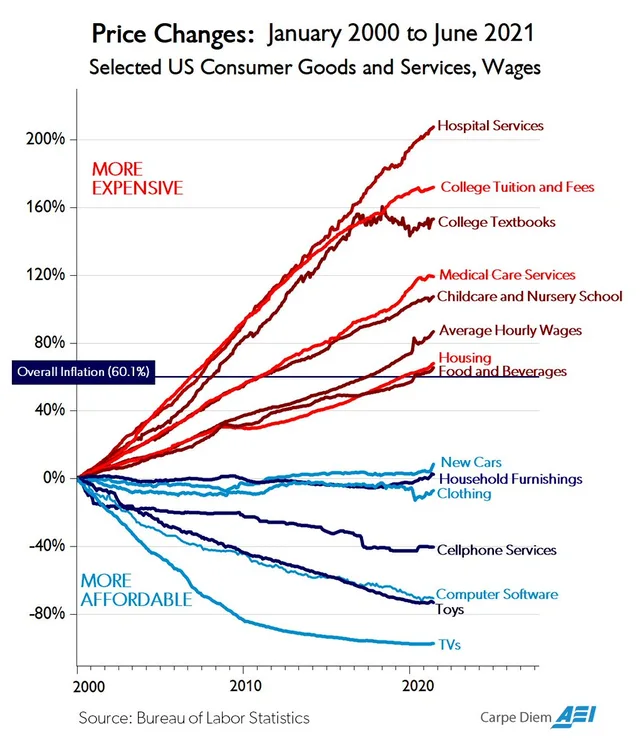
Inflation Price Chart

Line chart titled "Price Changes: January 2000 to June 2021. Selected US Consumer Goods and Services, Wages." A horizontal line marks "Overall Inflation (60.1%)". Red labels at top mean "MORE EXPENSIVE"; blue at bottom "MORE AFFORDABLE". Lines from highest to lowest: Hospital Services (about 207%), College Tuition and Fees, College Textbooks, Medical Care Services, Childcare and Nursery School, Average Hourly…