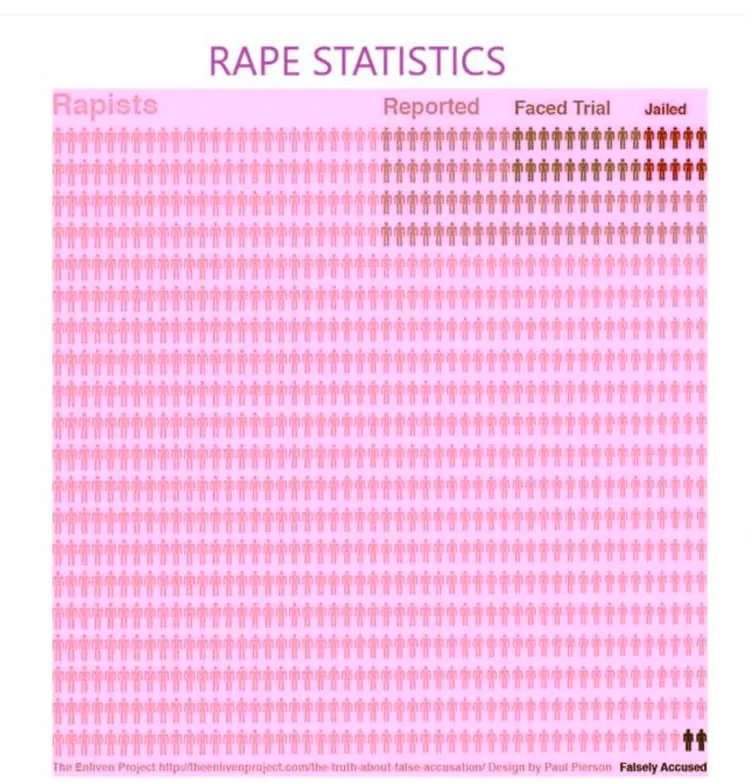
Rape Statistics Infographic Shows Reporting and Conviction Gap
A pictogram infographic using a grid of figures to show how few rapes are reported, tried or end in jail, versus false accusations. Not a nostalgia joke, but a data-driven share.
Image description
Infographic titled "RAPE STATISTICS": a pink grid of small human figures labeled "Rapists". Top-right figures are shaded to show "Reported", "Faced Trial" and "Jailed". Two black figures at bottom right are labeled "Falsely Accused". Footer: The Enliven Project http://theenlivenproject.com/the-truth-about-false-accusation/ Design by Paul Pierson



Comments
No comments yet. Start the thread.
Log in to comment and save favorites.