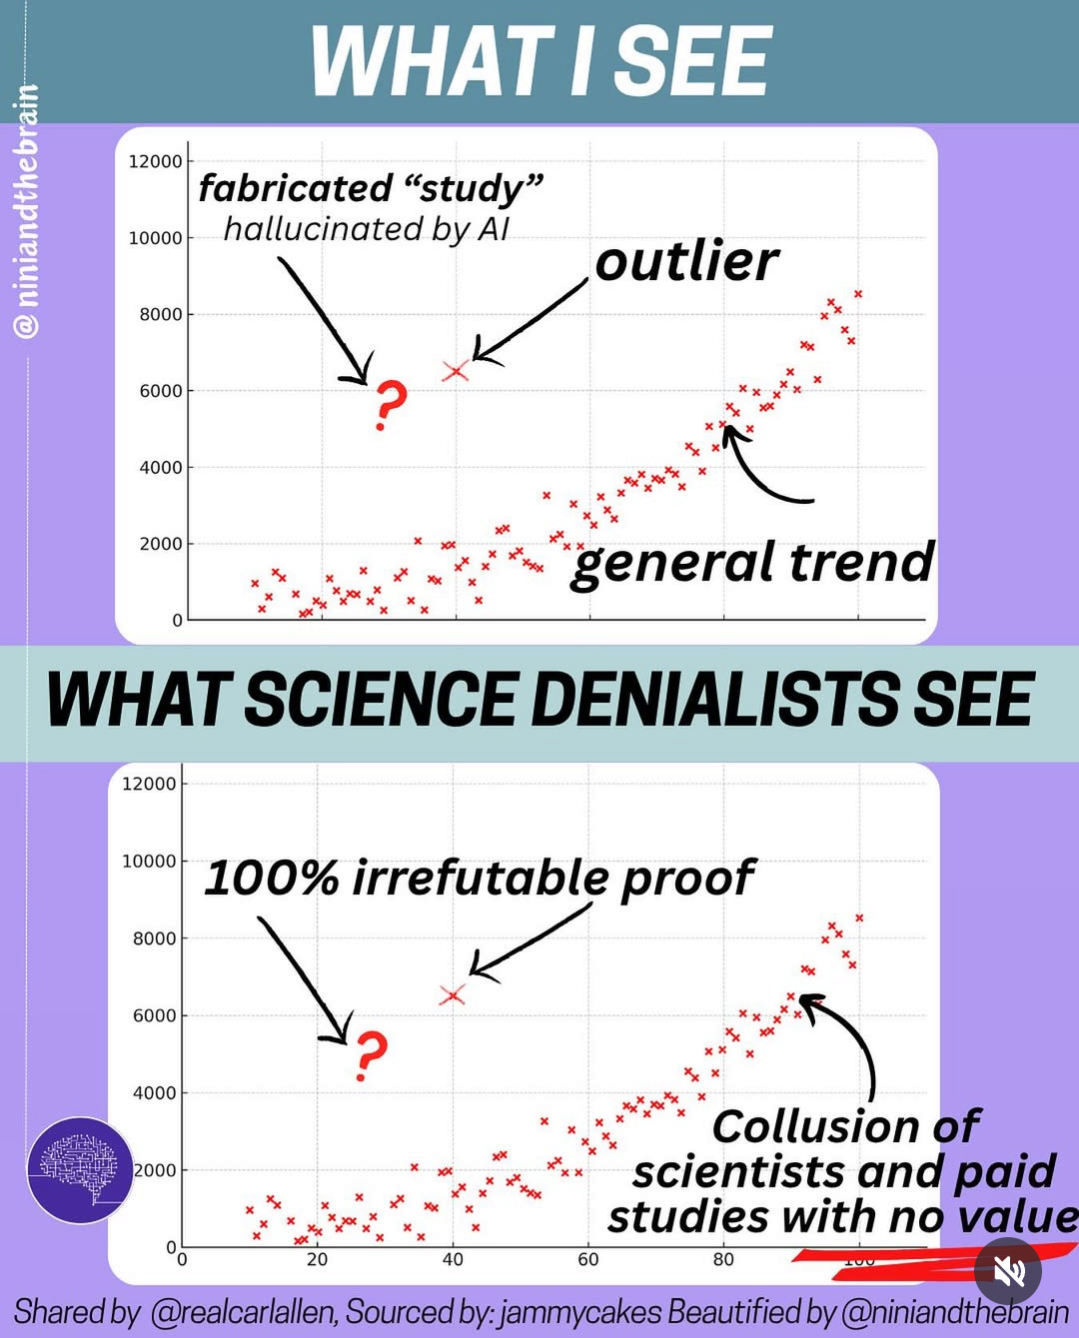
Same Scatterplot, Very Different Conclusions About Science
A two-panel scatterplot meme: one outlier versus an obvious upward trend, showing how science deniers treat a bad data point as proof and the real data as collusion.
Image description
Two-panel graphic with the same red scatterplot, trending upward with one outlier. Top banner: "WHAT I SEE". Labels: "fabricated "study" hallucinated by AI" with a red question mark, "outlier", "general trend". Banner: "WHAT SCIENCE DENIALISTS SEE". Same plot labels: "100% irrefutable proof", "Collusion of scientists and paid studies with no value". Footer: "Shared by @realcarlallen, Sourced by: jammycakes…


Comments
No comments yet. Start the thread.
Log in to comment and save favorites.