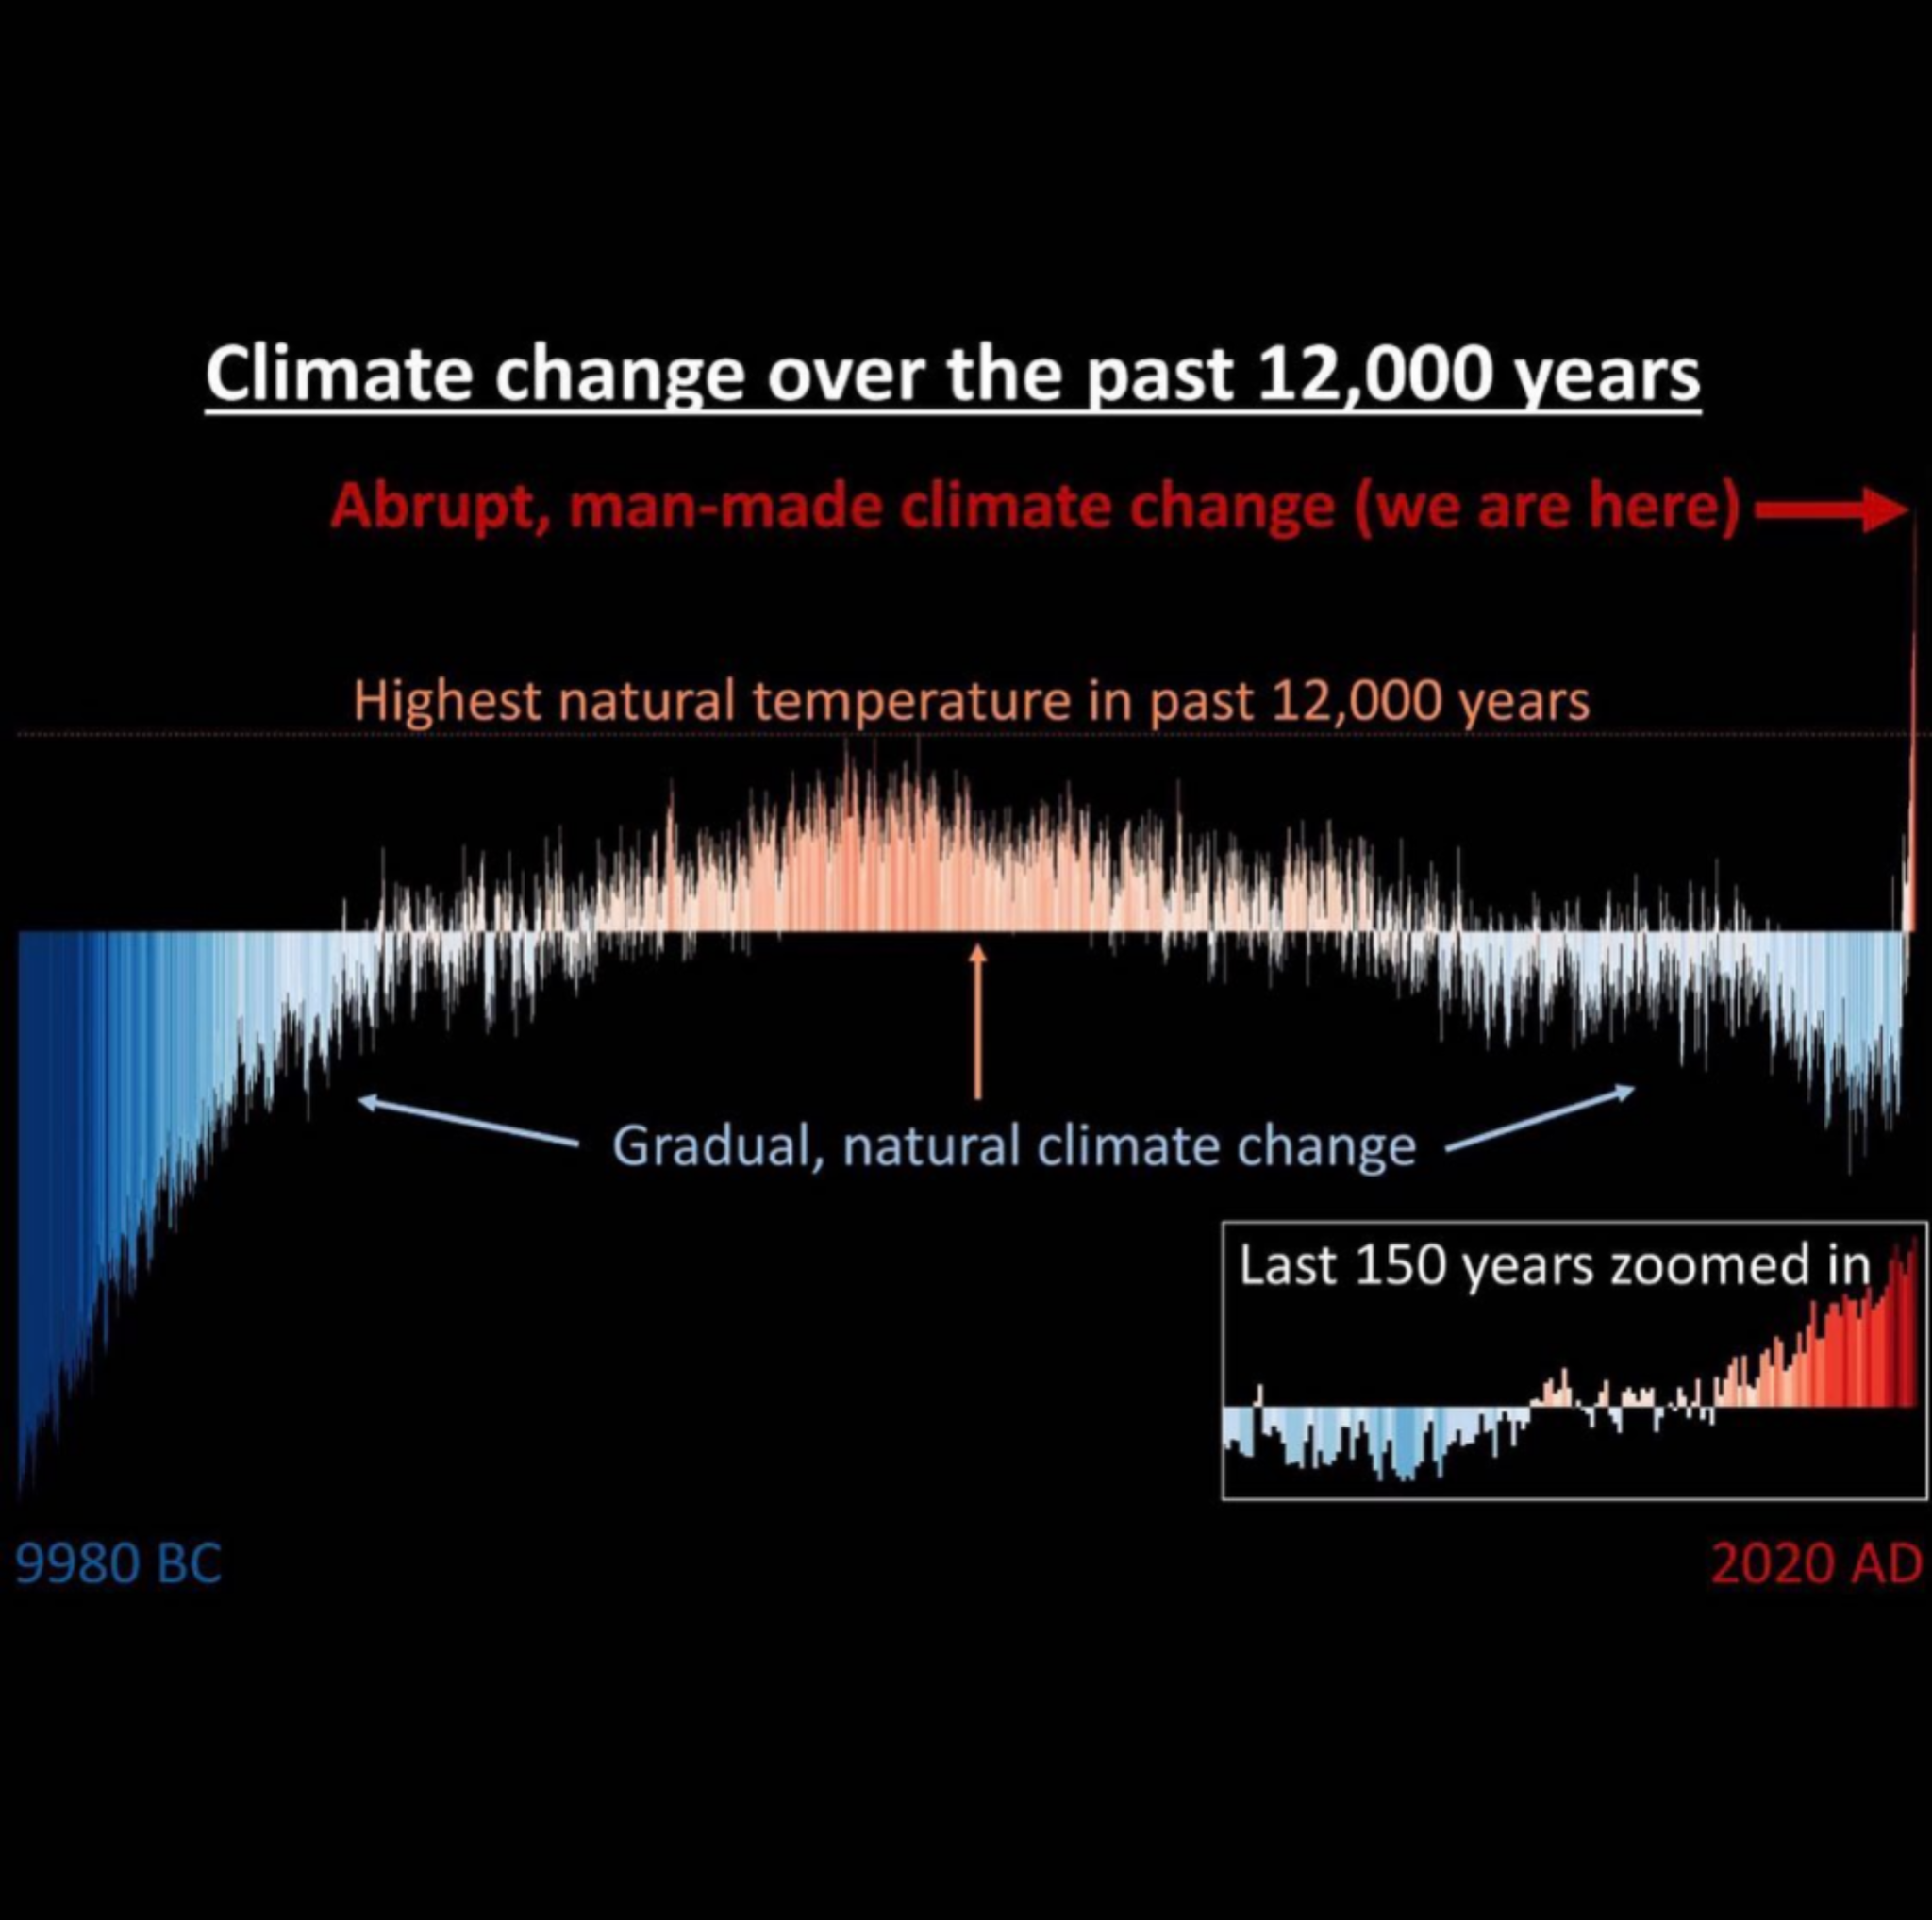
12,000 Years of Climate Change in One Chart
A climate chart shows 12,000 years of gradual natural temperature shifts dwarfed by a sharp modern spike, a science-class lesson Xennials never saw in school.
Image description
Dark chart of temperature bars from 9980 BC (blue, cold) to 2020 AD (red, hot). Title: "Climate change over the past 12,000 years". Labels: "Abrupt, man-made climate change (we are here)" with a red arrow at a spike on the far right; "Highest natural temperature in past 12,000 years"; "Gradual, natural climate change". Inset: "Last 150 years zoomed in".


Comments
No comments yet. Start the thread.
Log in to comment and save favorites.