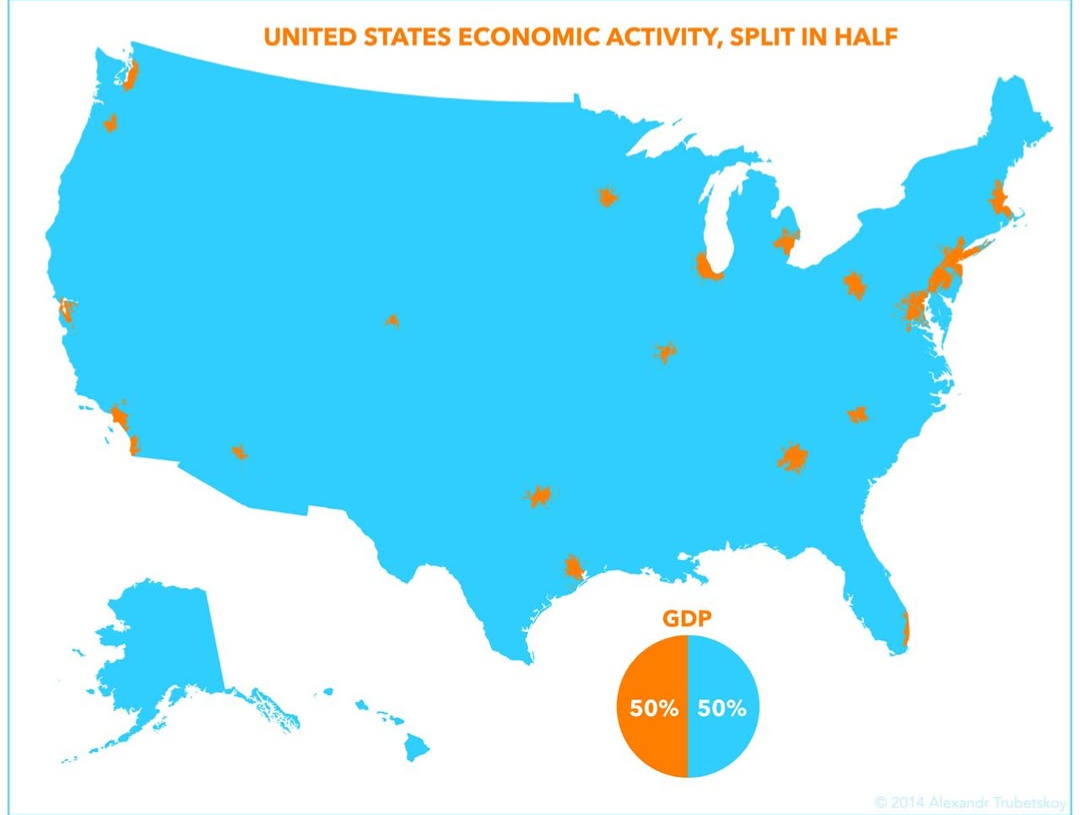
Half the US Economy Fits in Tiny Orange Dots
A map showing that half of US GDP comes from a few small orange metro areas while the vast blue rest makes up the other half. A civics and economics class lesson.
Image description
Map of the United States in bright blue with small orange patches marking major metro areas, such as Seattle, the Bay Area, Los Angeles, Chicago, Houston, Atlanta and the Northeast corridor. Title: "UNITED STATES ECONOMIC ACTIVITY, SPLIT IN HALF". A pie chart labeled "GDP" shows 50% orange, 50% blue. Credit: "© 2014 Alexandr Trubetskoy".





Comments
No comments yet. Start the thread.
Log in to comment and save favorites.