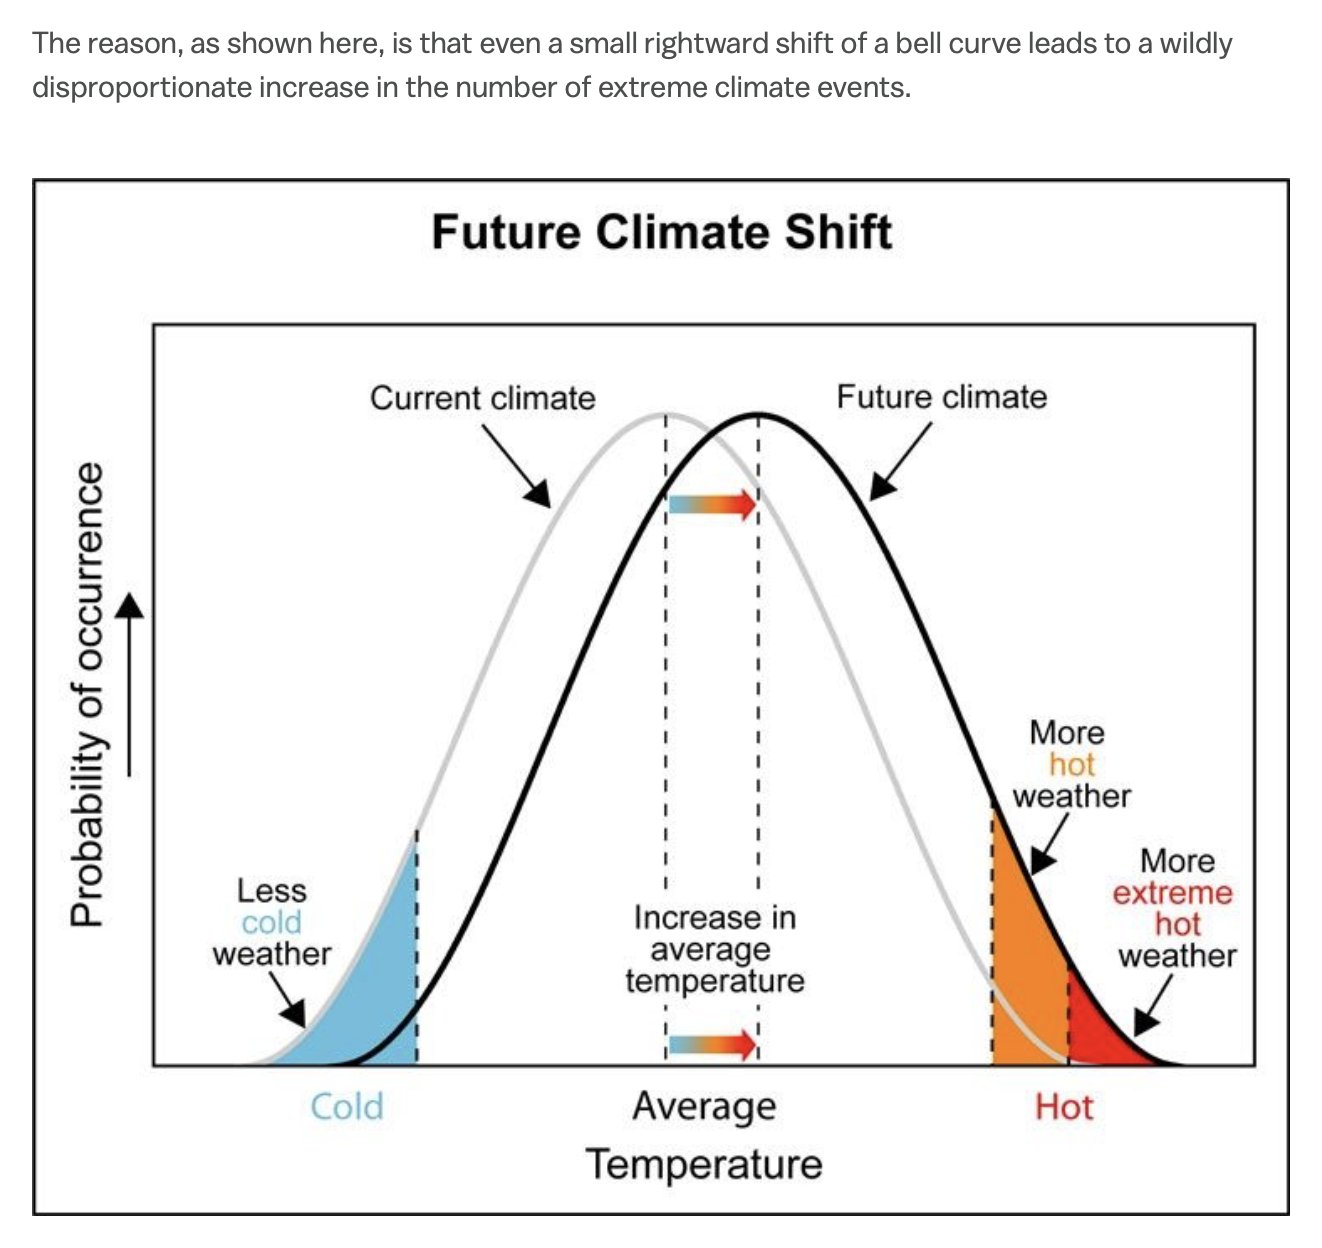
Bell Curve Shift Explains Extreme Weather Spikes
A bell curve chart shows how a small rise in average temperature sharply increases extreme hot weather, a science-class lesson on climate change that hits grown-up reality.
Image description
Screenshot of article text reading "The reason, as shown here, is that even a small rightward shift of a bell curve leads to a wildly disproportionate increase in the number of extreme climate events." Below is a chart titled "Future Climate Shift" with two bell curves, a gray "Current climate" and a black "Future climate" shifted right. Labels: "Probability of occurrence", "Increase in average temperature", "Less…





Comments
No comments yet. Start the thread.
Log in to comment and save favorites.