Gen X Got the Lead, Literally
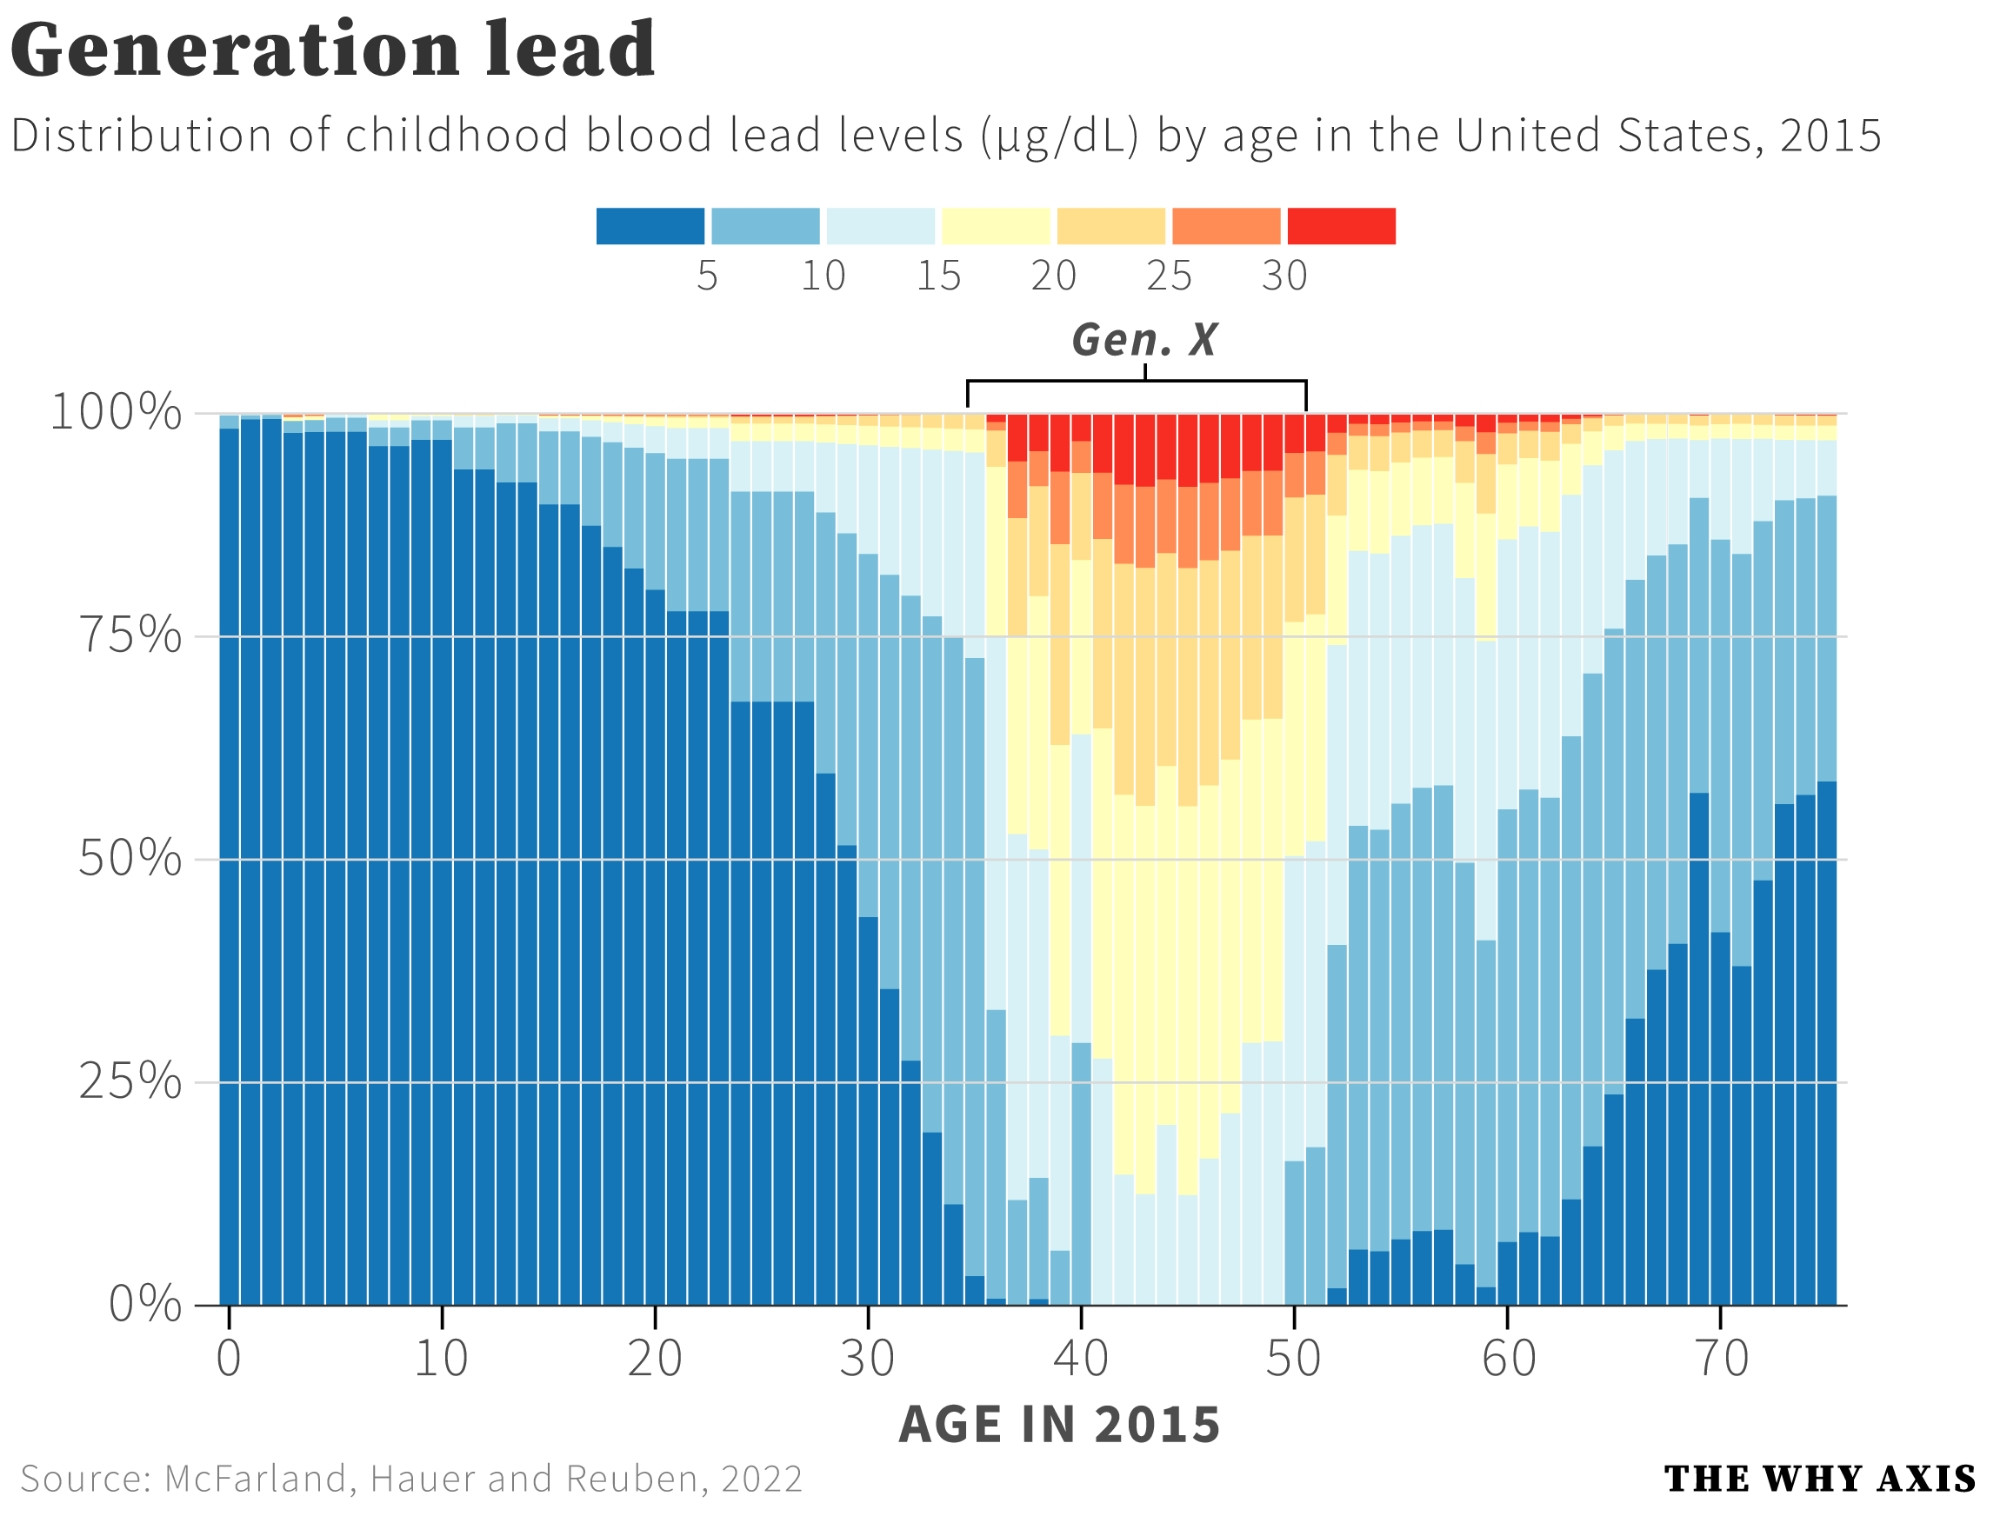
A chart of childhood blood lead levels by age shows Gen X and older Xennials with the highest exposure, a leaded-gasoline joke that is really a data point.
Image description
Stacked bar chart titled "Generation lead". Subtitle: "Distribution of childhood blood lead levels (µg/dL) by age in the United States, 2015". Color legend runs from blue at 5 through 10, 15, 20, 25 to red at 30. A bracket labeled "Gen. X" spans roughly ages 35 to 50, where the bars show red, orange and yellow high lead levels. Younger and older ages are mostly blue. X-axis: "AGE IN 2015". Source: McFarland, Hauer…





Comments
No comments yet. Start the thread.
Log in to comment and save favorites.